
ECG 101 2.0 CE Hours


Course Objectives:
- List the different waveforms on an ECG, their physiological correlation and additional investigations that may be needed.
- Discuss the different atrial and ventricular arrhythmias that can be visualized on an ECG.
- Describe the use of ECG to assess MI, heart blocks and hyperkalemia.
Abstract
The key to reading an ECG is practice, practice and more practice. There is no substitute for practice. Because even the normal ECG tracing can be somewhat variable, it is vital to know what a normal ECG looks like before one can start to analyze the strip for any cardiac disorders. The critical component of the ECG that needs to be understood is the P-QRS-T waveform.
Needs Assessment
ECG is a valuable investigative tool for many cardiac disorders. However, it should never be used alone to make a diagnosis of any specific medical disorder. ECG is usually used in combination with clinical findings, laboratory data and imaging studies to rule in a particular medical disorder, like an MI. Even though ECG is preferentially read by physicians, allied healthcare workers play a vital role in obtaining studies to compliment ECG-thus, an interprofessional approach to reading the ECG is vital. Basic knowledge of ECG is vital for paramedics, ER personnel and nurses.
The ECG monitors the electrical activity of the heart and transforms that activity to pulse rates values and waveforms that can be viewed on a monitor or printed. In the standardized system 10 electrodes are placed on the body – one on each arm, one on each leg and four on the left chest area around the heart. The electrodes or patches must be placed on clean skin, without any lotion or oils and during the ECG procedure the patient must remain still without movement or talking.
The key to reading or understanding an ECG is practice, practice and more practice. There is no substitute for practice. Because even the normal ECG tracing can be somewhat variable, it is vital to know what a normal ECG looks like before one can start to analyze the strip for any cardiac disorders.1-6 It is important to remember that the ECG is only one modality to investigate patients with chest pain. Other complimentary studies to investigate chest pain and dysrhythmias include imaging, laboratory studies and invasive radiology.
PQRST Complex
The critical component of the ECG that needs to be understood is the P-QRS-T waveform as shown below.
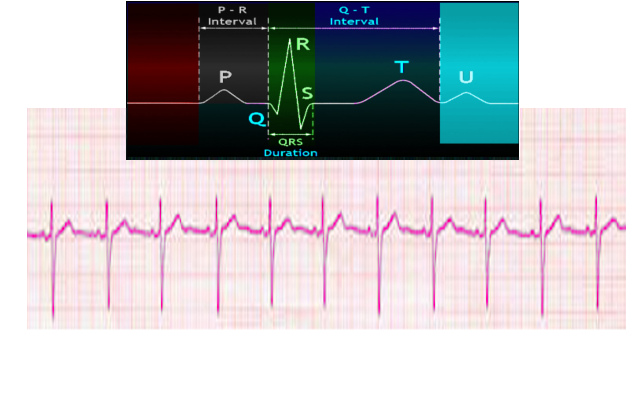
The image above shows a magnified view of the PQRST waveform.
The atrial contraction on the ECG is manifested by the P-wave. Atrial muscle mass is small -so the electrical charge is small. All atrial arrhythmias relate to the P wave.
The ventricular mass is larger and creates a bigger deflection on ECG. This is manifested by the QRS complex. The QRS is altered in ventricular arrhythmias. It may become wide or narrow.
The T wave represents repolarization or recovery of the ventricle to the baseline.
The U-wave is not always seen because it is very small and usually follows the T wave. It is believed that U waves represent repolarization of the papillary muscles.
Once the reasons for the waveform are understood, the next step is to understand two intervals on the PQRST complex-see below image.
ECG Intervals
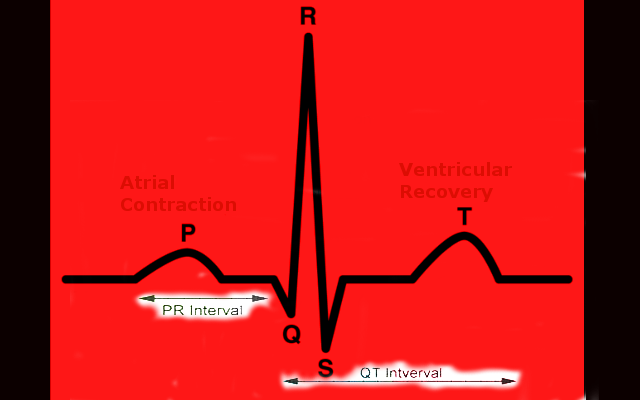
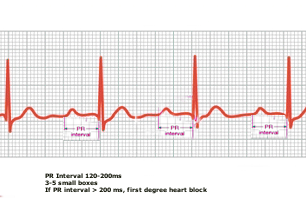
PR Interval- from start of P wave to start of QRS complex. The PR interval is often prolonged in heart blocks.
QT Interval – from start of QRS complex to end of T wave
The approximate distance of these two intervals must be appreciated. (See later)
ECG Squares
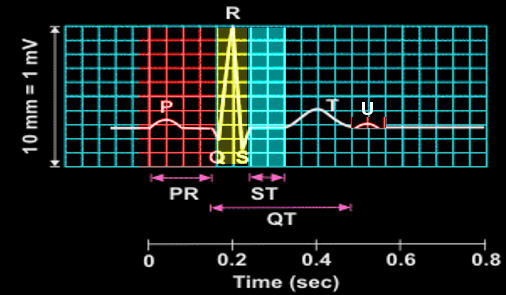
ECG is always run on a paper with grids. In a normal ECG, there are certain features that one must identify in order to interpret the tracing. The ECG image below shows the PQRST waveform.
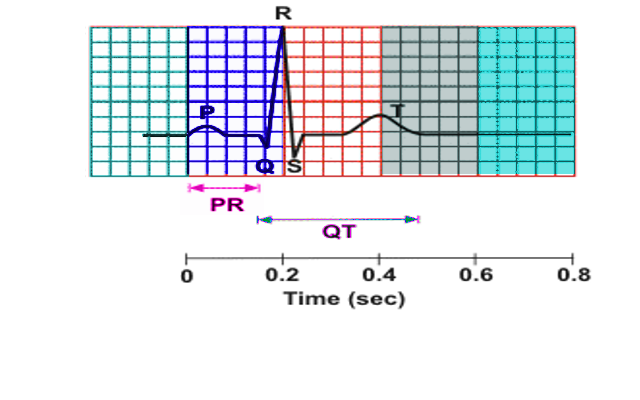
Each color in the above image represents one large square, which is 0.2 seconds. Five small squares make up one large square horizontally. Each large square is 5 mm and represents 0.2 sec. Five large squares represent one second. The entire PQRST complex is about 1 second, which represents all the 5 different colored boxes.
The P wave and QRS complex
The P wave is usually 1-2 small squares and the PR interval is usually 3-5 small squares. When the PR interval is greater than 5 small squares, then one should suspect first-degree heart block.
The QRS wave is usually 1-2 small squares. If it wider than 3 small squares, this is considered abnormal.
Normal Values on the ECG
Heart rate 60-100 bpm
PR Interval 0.12-0.2 s (less than one large square)
QRS interval < 0.12 s (less than 3 small squares)
QT interval for males is less than 0.4 s and females it is 0.44s.
Approach to the ECG
There are many ways to read an ECG but each person has his /her own method. The aim is to develop a systematic approach so that nothing is missed.
Developing a systematic approach to the interpretation of the ECG is a critical skill for all clinicians. The following outlines one such approach.
- Assess the rhythm of the heart-is it regular or irregular. When the rhythm is regular, the RR interval or QRS complex is constant. This can be assessed by using calipers or markings on a piece of paper and comparing successive waves.
- Always check to see if there is a P wave before the QRS. This reveals if the rhythm is sinus. Sometimes, the rate may be very fast and the P waves may not be visualized. The P wave shape is generally smooth, not notched or peaked. P waves are usually upright.
- Look for Q waves. Assessing for Q waves should be done to look for an acute myocardial infarction and a patient history may help. It is important to know that small Q waves are normal in leads lll and aVF and in anterolateral leads aVL, l, V5 and V6. Q waves that are more than 1 mm duration and greater than 1/3 of the R wave amplitude are considered pathological.
- Look at the ST segment. Determine if the ST segment is elevated or depressed. ST segment elevation may be an indication of acute myocardial infarction, angina, pericarditis, myocardial ischemia or ventricular aneurysm. They may be slightly elevated in some leads over the heart (precordial leads). The ST segment is almost never normally depressed greater than 0.5 mm in any lead.
- T wave is generally in upright and in the same direction as the QRS complex. In some asymptomatic adults, isolated T wave inversions may be normal.
- Learn to measure the QT interval. This interval may be prolonged due to certain medications or metabolic disorders. It must be corrected for heart rate because it is rate dependent. The QT interval is usually less than or equal to 0.40 seconds for males and 0.44 seconds for females.
- If there are arrhythmias, are they ventricular or supraventricular (another term to describe atrial arrhythmias that arise above the AV node).
Determining Heart Rate
ECG is printed on a paper at a speed of 25 mm/second. This is standardized and 5 mm = 0.2 seconds or 1 large square. Therefore, 5 large squares represent one second. There are a number of ways to determine the heart rate.
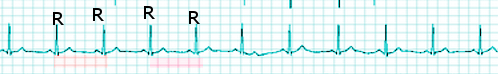
In method 1, shown below. The ECG below shows regular R waves. The successive R waves occur after 5-large squares (which represents one second). Hence, there is one beat (R –wave per second) and this equals 60 beats per min. The squares highlighted in color red show the distance from R-R wave.
In method 2, one can use the ECG grid to calculate heart rate. First locate a QRS complex at the beginning of a large square. Then locate the next QRS complex (see below).
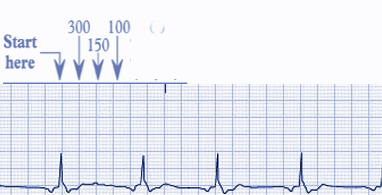
If there is another QRS complex separated by one large box, the heart rate is 300 bpm (300/1).
If the QRS complex is separated by 2 large squares, the heart rate is 150 bpm (300/2).
If the QRS is separated by 3 large squares, the heart rate is 100 bpm (300/3).
If the QRS is separated by 4 boxes, the heart rate is 75 bpm (300/4) and so on.
In the above ECG, the next QRS complex occurs at the 5th square and hence the rate is 300/5= 60 bpm.
Remember this is a rough estimate and depends on regular waves. Most digitally derived ECG obtain a reliable heart rate within 1-5% of the true heart rate (obtained by pulse measurement).
Atrial Arrhythmias
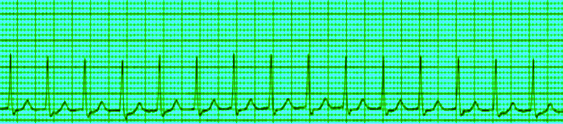
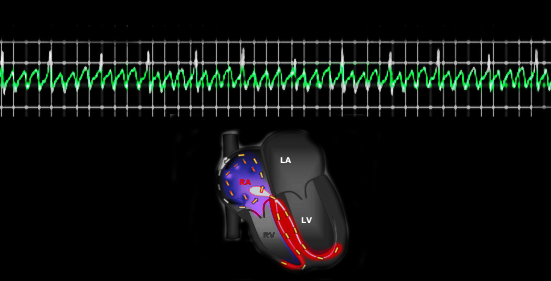
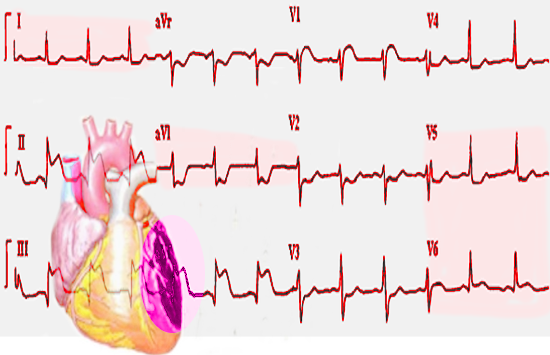
With atrial tachycardia, there is a regular heart rate that is usually greater then 100 bpm (image 1). The QRS complex is narrow but the P-waves often may not originate from the sinus node but from other sites in the atria. Vagal stimulation may slow down the AV conduction. The rhythm is usually regular and fast. The successive QRS complex falls after 2 large boxes, hence 300/2= a heart rate of 150 bpm.
Image 1
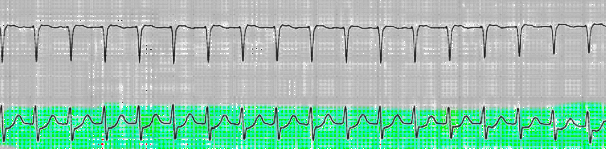
The ECG in 2 different leads below is from a patient with fever after surgery (Image 2). He presented with palpitations. ECG reveals atrial tachycardia. The rate is regular. The QRS complex is narrow and P waves are not obvious.
Image 2
Atrial Flutter
Atrial flutter is easy to recognize on the ECG by its characteristic flutter waves at a regular rate of 220-400 beats per min. The individual flutter waves are often symmetrical, resemble p waves or may be asymmetrical with a “saw tooth” shape (image 3). The disorder is managed in the same fashion as atrial fibrillation. Both rhythms can lead to formation of thrombus in left atrium. In order to check for thrombus in the heart chambers, one needs to get an echocardiogram.
Image 3
Atrial Fibrillation
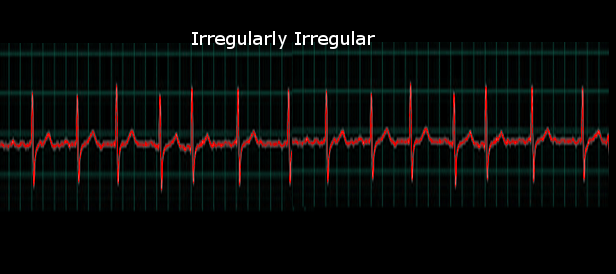
Atrial fibrillation is a very common arrhythmia. It may cause no symptoms in some but in others, it may be associated with palpitations, dizziness, chest pain and even heart failure. The ECG often reveals an irregularly irregular heart rate (image 4). There are no P waves seen and the electrical activity is often disorganized. The QRS complex is narrow but in rare cases, at very fast heart rates, atrial fibrillation may appear regular and mimic ventricular tachycardia. Because long standing atrial fibrillation can result in a thrombus in the left atrium or ventricle, it is vital not to cardiovert the patient before obtaining an echocardiogram.
Image 4
Myocardial Infarction and Coronary Vessels
In general, the three coronary vessels, which cause myocardial infarction/ischemia, include the left anterior descending, circumflex and right coronary artery. When the right coronary artery is occluded, patients develop an inferior wall MI. When the left anterior descending coronary is occluded, an anterolateral MI develops. When the circumflex is occluded, a lateral wall MI develops. The gold standard for evaluating the patency of the coronary vessels is still cardiac catheterization. Other less invasive means of studying the post MI heart include a stress test, nuclear scan, echocardiogram and Cardiac CT scan.
Figure 5 showing the anatomy of the coronary arteries. 1= aorta, 2= right coronary artery, 3= left anterior descending coronary, 4= circumflex coronary and 5 = pulmonary artery. Cardiac angiogram is required to assess for blockage of the coronary vessels.
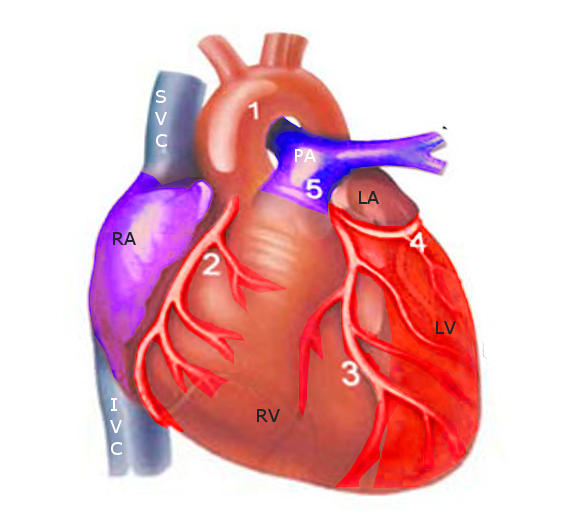
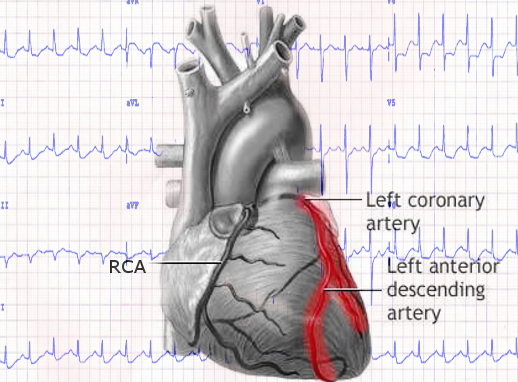
Image 6 below shows the right coronary artery and it course to the inferior aspect of the heart. The left main coronary gives rise to the left anterior descending coronary artery, which when occluded causes and anterolateral MI. The circumflex coronary (not shown) also comes off the left main coronary and at the back of the heart. When occluded, it gives rise to a lateral wall MI.
Image 6
ECG and Myocardial Infarction
The diagnosis of an MI is not only based on an ECG but also elevated cardiac enzymes. Even though troponin levels are now used to make a diagnosis of an MI, other markers that may be ordered include creatine phosphokinase, and myoglobin. Levels of myoglobin are released more rapidly from infarcted myocardium than is troponin.
Within hours of an MI, the ECG will show changes that are often quite prominent. The first changes after an MI is prominent T waves, followed by ST segment elevation. This is followed by Q waves and return of the ST segment to baseline (images 8 & 9). In some cases, elevated ST segments may persist if the patient develops a complication like a ventricular aneurysm or perforation of the septum.
Figure 7 shows release of cardiac biomarkers after an MI. Myoglobin is often the first marker to be detected in blood.
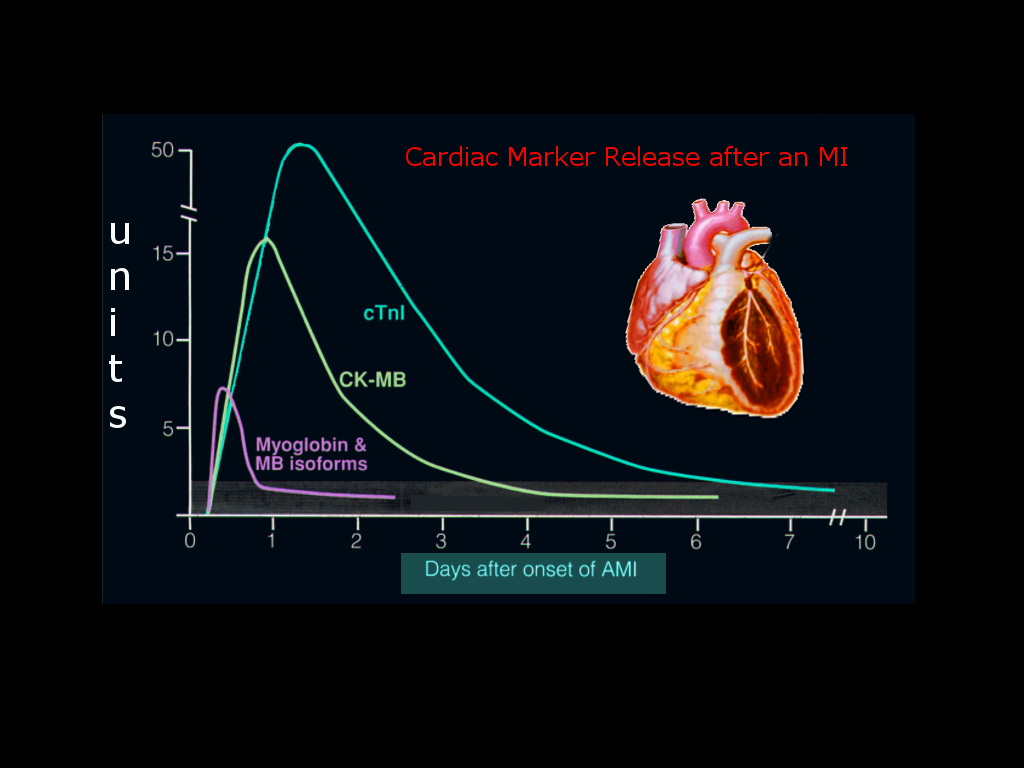
Image 8
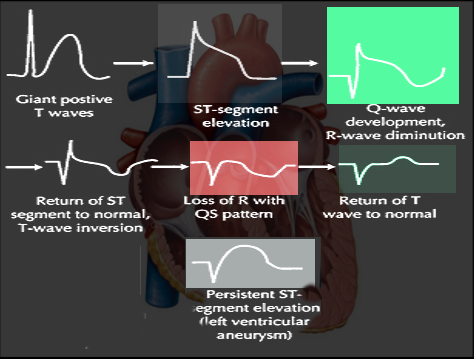
Image 9
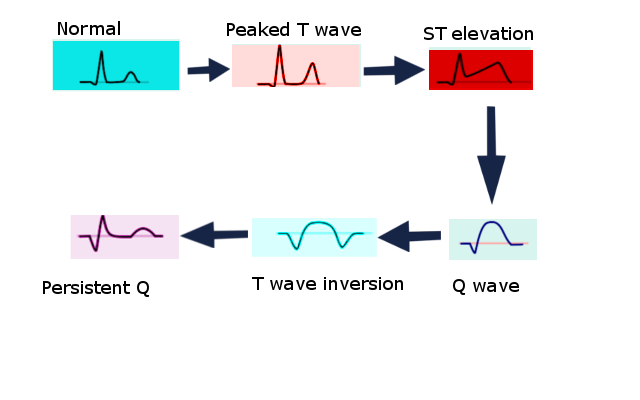
Another simplified view of the progressive ECG changes that occur following an MI.
Localization of an MI on the ECG
The ECG can also help localize the myocardial infarct by assessing changes in particular leads. In general, one should look at the following leads for specific infarct locations:
MI Leads Blood vessel
Anterior V1-V6 LAD
Lateral l, aVL, V5,V6 Circumflex/obtuse
Marginal
Inferior ll, lll, aVF RCA
To confirm the MI and occlusion of the coronary artery requires an angiogram.
Anterolateral MI
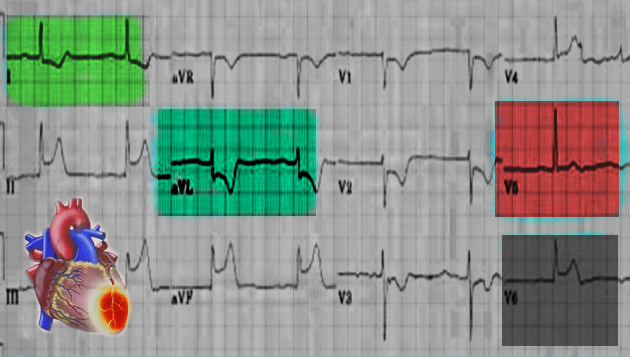
Anterolateral wall MI is recognized by observing ST segment changes in leads 1, aVL and precordial leads overlying the anterior and lateral surface of the heart (V3-V6). Anterolateral wall MI occurs because of coronary artery disease in left anterior descending or circumflex coronary artery. Arrhythmias that may be seen with this MI include right or left bundle branch blocks, or type 2-second degree heart block. Image below is from a patient with an anterolateral MI. The specific leads are colored (image 10).
Image 10
Lateral Wall MI
Lateral wall MI may occur when there is occlusion of the left circumflex or the obtuse marginal coronary artery (image 11). Changes may be seen in leads l, aVL, V5 and V6.
Image 11
Inferior Wall MI
Inferior wall MI occurs when there is occlusion of the right coronary artery (image 12). On the ECG, inferior wall MI will present with changes in leads 11, 111 and aVF. The Q waves are often largest in lead 111 and smallest in lead 11.
Image 12
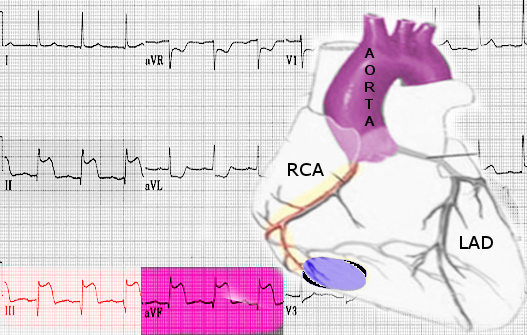
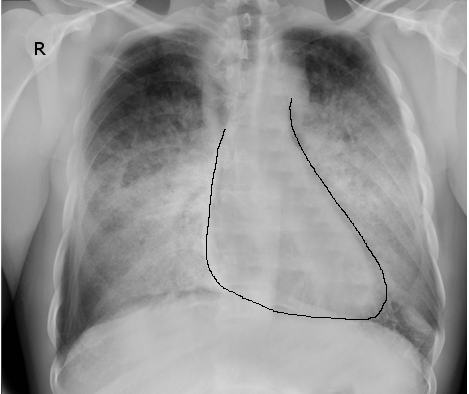
Figure 13 shows florid pulmonary edema in a patient with an anterolateral wall MI.
Sinus Bradycardia
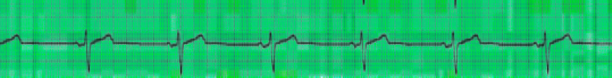
Sinus bradycardia is a heart rhythm that originates from the sinus node and has a heart rate of less than 60 beats per min. Sinus bradycardia is not always pathological and is often seen in well-trained athletes. The ECG will reveal a regular slow heart rate with normal p-waves. Other causes of bradycardia include hypothyroidism, use of beta-blockers, inferior wall MI, and hypothermia. If the patient is symptomatic, IV atropine can be administered.
ECG below from a patient with p-waves, narrow QRS and a slow heart rate (image 14). Between each QRS complex, there are 6-7 large boxes. This gives a heart rate of 300/6= 60 bpm.
Image 14
Heart Blocks
First Degree Heart Block
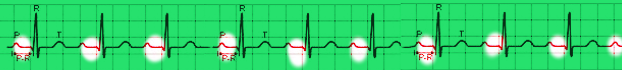
First degree heart block or PR prolongation is said to occur when the PR interval is longer than 0.20 seconds. First-degree heart block is often seen in young people and rarely of any significance. Common causes of first-degree heart block include enhanced vagal tone, acute MI, electrolyte disturbances and medications (e.g. digoxin, beta-blockers, calcium channel blockers)
ECG below reveals P-waves, a narrow QRS and a regular heart rate (image 15). Of note is the prolonged PR interval-larger then one big square. If the PR interval is > 0.2 s, a fist degree heart block is diagnosed. Most patients are asymptomatic and do not require treatment. Between each successive QRS, there are 5 large squares, giving a heart rate of 300/5= 60 beats per min.
Image 15
ECG from another patient with a slightly prolonged PR interval. The p-waves are visible (image 16), the QRS is narrow the heart rate is regular. The PR interval appears to be slightly larger than one large square. Between each successive QRS complex, there are 4 large squares, giving a heart rate of 300/4 = 75 beats per min.
Image 16
Second-Degree Heart Block Type 1
There are two types of second-degree heart blocks and it is important to understand them, as the treatment does depend on the type. It is important to check levels of electrolytes and drugs (e.g. digoxin) if one suspects a 2nd or 3rd degree heart block. If an MI is suspected, cardiac enzymes should be ordered. Echocardiogram is useful if the patient has aortic stenosis with calcification, congenital heart disease or a cardiomyopathy
Second-degree heart block type 1 (mobitz 1 or Wenckebach) occurs due to some disorder of the AV node. In the ECG below (image 17), one can see normal p waves and a narrow QRS.
Image 17
The ECG reveals a gradual prolongation of the PR interval in preceding beats followed by a non-conducted p wave (dropped QRS). After the dropped QRS complex, the PR interval resets itself and the cycle repeats itself. This type of heart block is benign and no specific treatment is indicated as long as the patient has no symptoms. IV atropine or isoproterenol can be used to improve the conduction rate.
Second-Degree Heart Block Type 2.
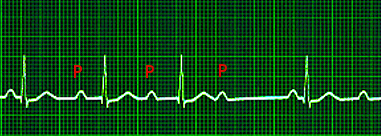
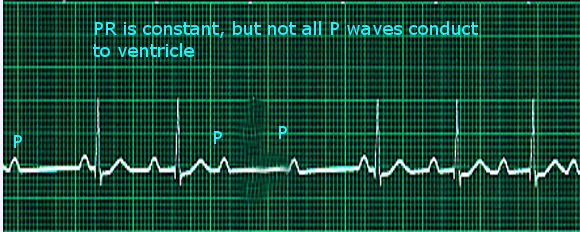
Unlike the type 1-second degree heart block, the type 2-second degree AV block is featured by presence of intermittent non-conducted p-waves. In addition, the PR interval is not prolonged. This type of heart block is dangerous and can rapidly progress to complete heart block. The definitive treatment for second-degree heart block type 2 is a permanent pacemaker. The impairment is usually due to disease of the distal conduction system or purkinje fibers.
Type 2-second degree AV block is characterized by intermittently non-conducted p waves that are not preceded by PR prolongation. This type of heart block is dangerous and can rapidly progress to complete heart block. The definitive treatment for this type f heart block is a permanent pacemaker. The impairment is usually due to disease of the distal conduction system or purkinje fibers.
ECG below shows normal P waves and narrow QRS (Image 18). What can be seen is that not every P wave is preceded by a QRS complex. The PR interval appears to be constant. This patient needs to be in the ICU and have a permanent pacemaker ASAP, as complete heart block can occur anytime.
Image 18
Third Degree Heart Block
In this serious medical disorder, there is no connection between the atrium and ventricle. The impulse from the atrium is blocked and there is no QRS complex. The PR interval is variable and there is no relationship between the P wave and QRS complex. The heart rate is usually slow and imminent cardiac arrest is a real possibility. This type of heart block is a medical emergency requiring permanent pacing. The ECG below (image 19) shows non-conducted p waves and no relationship to the QRS complex.
Image 19
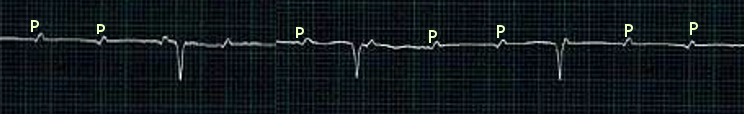
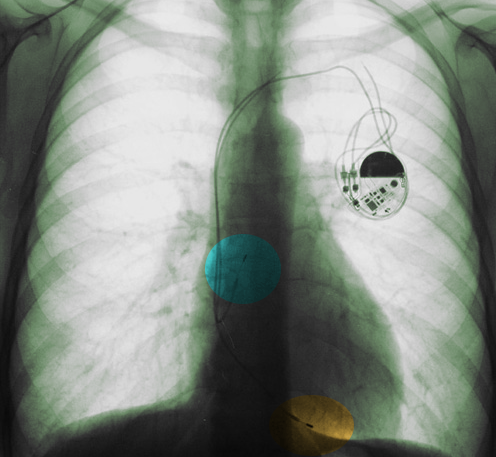
Figure 20 shows a CXR of a patient with a 3rd degree heart block who had a pacemaker inserted. The CXR shows leads in the right atrium and right ventricle.
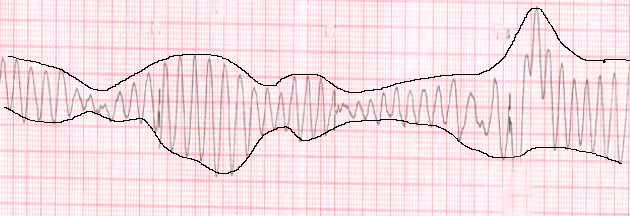
Torsades de Pointes
Torsades de pointe is a polymorphic ventricular arrhythmia with a variable QRS complex. The ECG will usually reveal a bizarre and irregular ECG with a gradual change in amplitude and twisting QRS complex (image 21). It is always associated with hypotension and may produce syncope. One should always check for hypocalcemia, hypokalemia and hypomagnesemia when torsades develops. Chest x-rays and echo can help rule out any structural heart disease. The rhythm can degenerate into ventricular fibrillation and without intervention, sudden death is common. Torsade is associated with the long QT syndrome.
Image 21
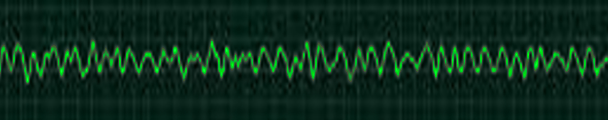
Ventricular Fibrillation
Ventricular fibrillation is the most common arrhythmia identified in patients with cardiac arrest. VF usually occurs following an MI, but can also occur after hypoxia, electrical shock administered during cardioversion, certain antiarrhythmic agents and certain pre-excitation syndromes. There are usually no clearly identifiable QRS complex or p waves (image 22). The base line also is wandering. The disorder needs immediate defibrillation. Unless the patient is revived, death will quickly follow. Appropriate lab studies in a patient with Ventricular fibrillation include the following:
- Levels of electrolytes
- Cardiac enzymes
- Complete blood count
- Arterial blood gas
- Drug levels (digoxin, quinidine, tricyclic antidepressants)
- Toxicology screen (providers should coordinate with lab for specimen collection procedures and transport).
- Thyroid stimulating hormone
Once the patient has been resuscitated and stabilized he/she may need an Echo, nuclear scan or coronary angiography to assess for presence of coronary disease.
Image 22
Ventricular Tachycardia
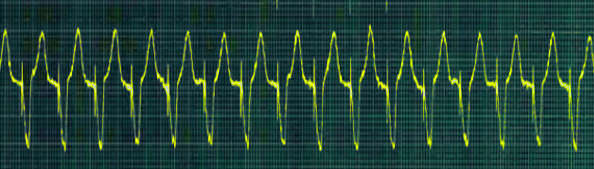
Ventricular tachycardia is defined as a sequence of three or more ventricular beats with a frequency of usually 100-120 beats per min. On the ECG, the QRS is usually wide; regular and p waves are rarely seen. VT is a medical emergency since it can deteriorate into ventricular fibrillation and result in cardiac arrest.
ECG below shows regular wide QRS complexes with no visible p-waves (image 23). This is typical of ventricular tachycardia.
Image 23
Wolff Parkinson White syndrome
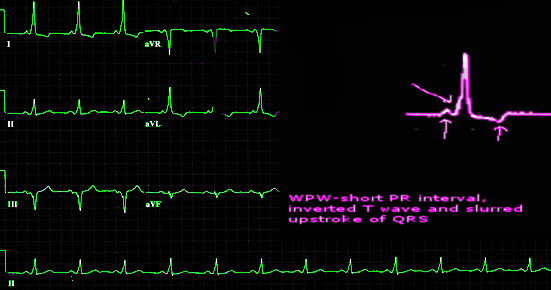
Wolff Parkinson white syndrome is a conduction disorder caused by presence of accessory electrical conduction pathways between the atrium and ventricle. In the disorder, there are many accessory pathways from the atrium going to the ventricle. Thus, the heart rate can be extremely fast. The abnormal electrical signals stimulate the ventricles to contract prematurely. ECG usually reveals a very short PR interval (less than 3 small squares), a slurred upstroke to the QRS (delta wave), wide QRS and secondary ST and T wave alterations. There is no specific blood work for WPW, but levels of electrolytes, thyroid hormone, drugs, lactate and a drug screen may be performed.
The ECG below (image 24) shows a magnified QRS complex to the right. The arrow after the p wave points to a slurred upstroke in the QRS complex. The QRS is also wide and the PR interval is short.
Image 24
Electrolytes and ECG
In some cases, the ECG may be the first sign of electrolyte alterations.
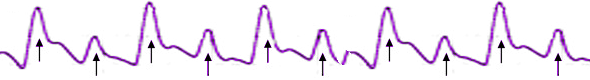
Peaked T waves
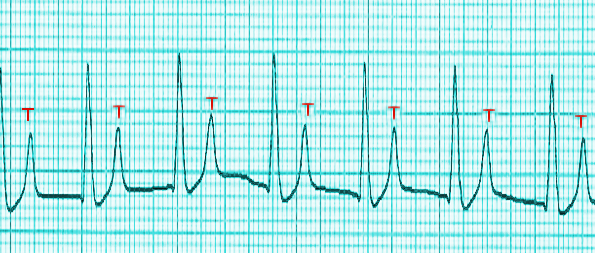
T-waves represent repolarization of the ventricle. In most leads, the T wave is positive. Of note is that tall and narrow T waves (peaked T wave) are indicative of hyperkalemia. When patients have high levels of serum potassium (>6.4mEq/L), the ECG will often show peaked T waves. At this point, immediate measurement of serum potassium levels is highly recommended to confirm the ECG. When treatment is instituted, the peaked T waves will start to decline.
The ECG below (image 25) shows peaked T waves in a patient with acute renal failure, after an MI.
Image 25
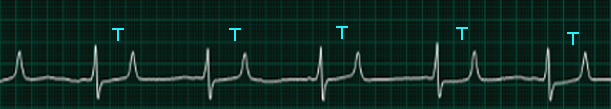
Another ECG of a patient who missed dialysis over the weekend and presented to the ER with general malaise (image 26). ECG revealed peaked T waves and emergency dialysis was performed because the potassium levels were greater than 7.2mEq/L.
Image 26
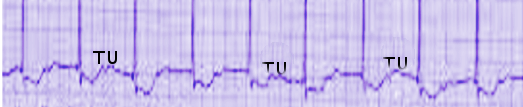
U waves
U waves are sometimes seen on the ECG. They usually follow the T wave. Prominent U waves are often seen in hypokalemia but may be seen in thyrotoxicosis, hypercalcemia and exposure to digoxin. An inverted U wave is often seen in myocardial ischemia. In younger athletic individual, a U wave may be a normal finding.
The ECG below shows U waves in a patient with hypercalcemia (image 27). The patient had multiple myeloma with serum calcium of 12.2mg/dL. Once treatment was instituted, the U waves disappeared.
Image 27
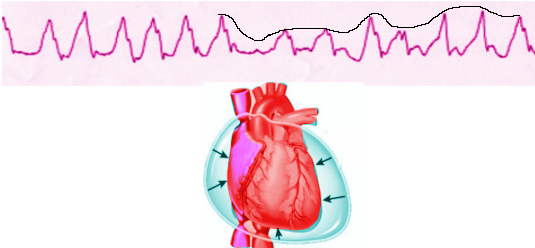
Tamponade
In cases of tamponade where fluid accumulates around the heart, ventricular filing is compromised. This potentially life-threatening disorder will present on the ECG with the following features:
- Sinus tachycardia
- Low voltage QRS complex
- Alternation of the QRS complex (Image 30)
- PR segment depression
The chest x-ray may show an enlarged cardiac silhouette, pericardial calcification or evidence of chest wall trauma. An echo provides useful information and guides treatment.
Figure 28 shows a normal Chest X-ray. Figure 29 shows a CXR of a patient with a massive cardiac tamponade after a knife stab to the anterior chest.
Figure 28
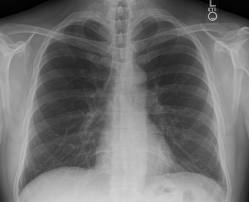
Figure 29
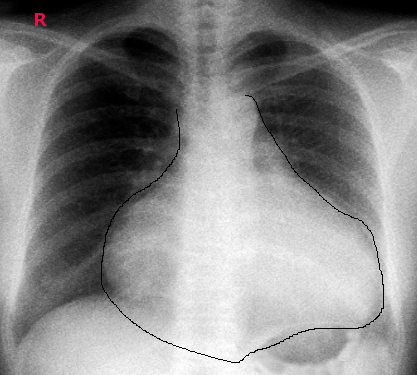 Image 30
When tamponade is suspected, an echo should be performed.
Electrical Alternans
Electrical alternans is an ECG phenomenon of alternating QRS complex amplitude between beats (image 31). The baseline may also be wandering in some cases. This rhythm is often seen in cardiac tamponade, angina, conduction abnormalities, cardiomyopathy and in patients with large pericardial effusions. Such a rhythm demands a search for the cause. Patients may often complain of dyspnea, chest pain or diaphoresis.
Image 31
References
- Yanowitz FG. ECG learning Center. http://ecg.utah.edu/. Accessed on Jan 15, 2015.
- ECG library. http://www.ecglibrary.com/ecghome.html. Accessed on Jan 4, 2015.
- Analysis and interpretation of the ECG. https://meds.queensu.ca/central/assets/modules/ts-ecg/. Accessed on Jan 4, 2015.
- ECG interpretation for Emergency Physicians. http://www.emedu.org/ecg/. Accessed on Jan 5, 2015.
- Fennessy G. ECG “rule of Fours.” http://lifeinthefastlane.com/ecg-rule-of-fours/
Accessed on Jan 5, 2015.
- Skillstat. http://www.skillstat.com/tools/ecg-simulator#/-play. Accessed on Jan 3, 2015.